

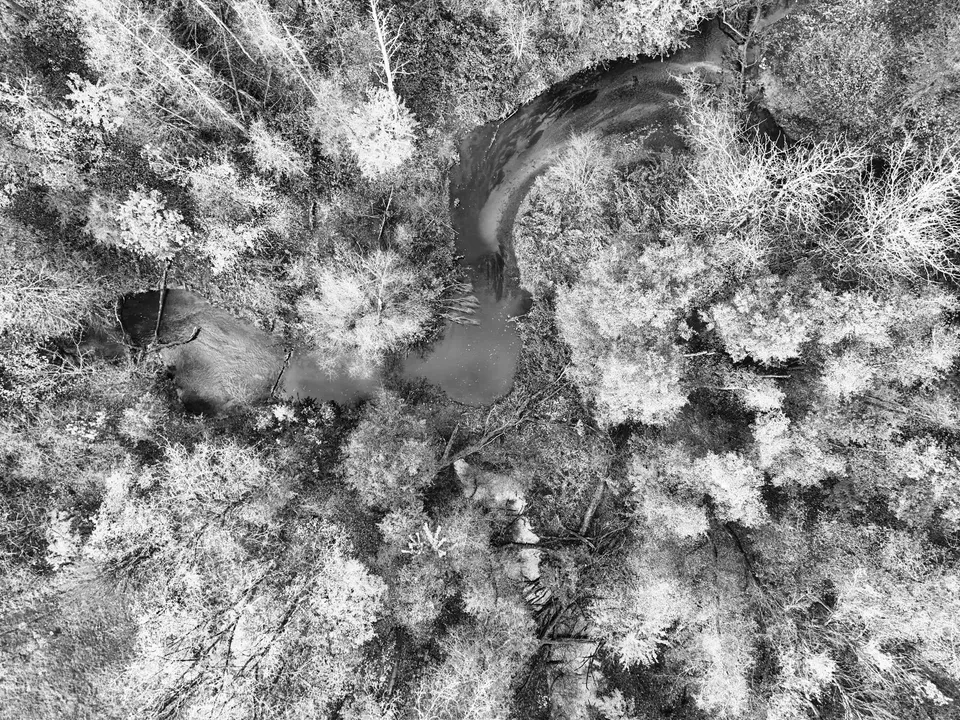
A new U.S. Geological Survey study gives Chesapeake Bay restoration managers a detailed view of where small streams are improving, where they are declining and where additional work may have the greatest value.
Researchers modeled annual biological conditions across 360,893 small, nontidal stream reaches from 1985 through 2023. They combined observations of benthic macroinvertebrates with land-cover, landscape and climate data to estimate conditions in places and years without direct monitoring.
Small gains, honestly measured
By 2021, the study predicted that roughly 0.9% to 1.1% of watershed stream length had improved on the Index of Biological Integrity. That is progress, but it remains far short of the Chesapeake Bay Program's goal of improving 10% of stream miles above the 2008 baseline.
The pattern was uneven. Some indicators improved across many southern streams while northern streams showed declines. Streams near Washington, D.C., and Baltimore consistently showed poor biological condition and declining trends across the study's indicators.
A better guide for the next repair
USGS says the modest net improvement is notable because developed land increased across the watershed during the study period. The analysis can also help managers identify higher- and lower-quality streams and focus future monitoring, conservation and restoration.
This is not evidence that the watershed is broadly recovered. The study covers small, nontidal streams and relies partly on model predictions rather than direct measurements at every reach. Its practical value is a consistent long-range baseline for deciding where the next restoration effort may matter most.
Reader responses